¶ SRT Statistics
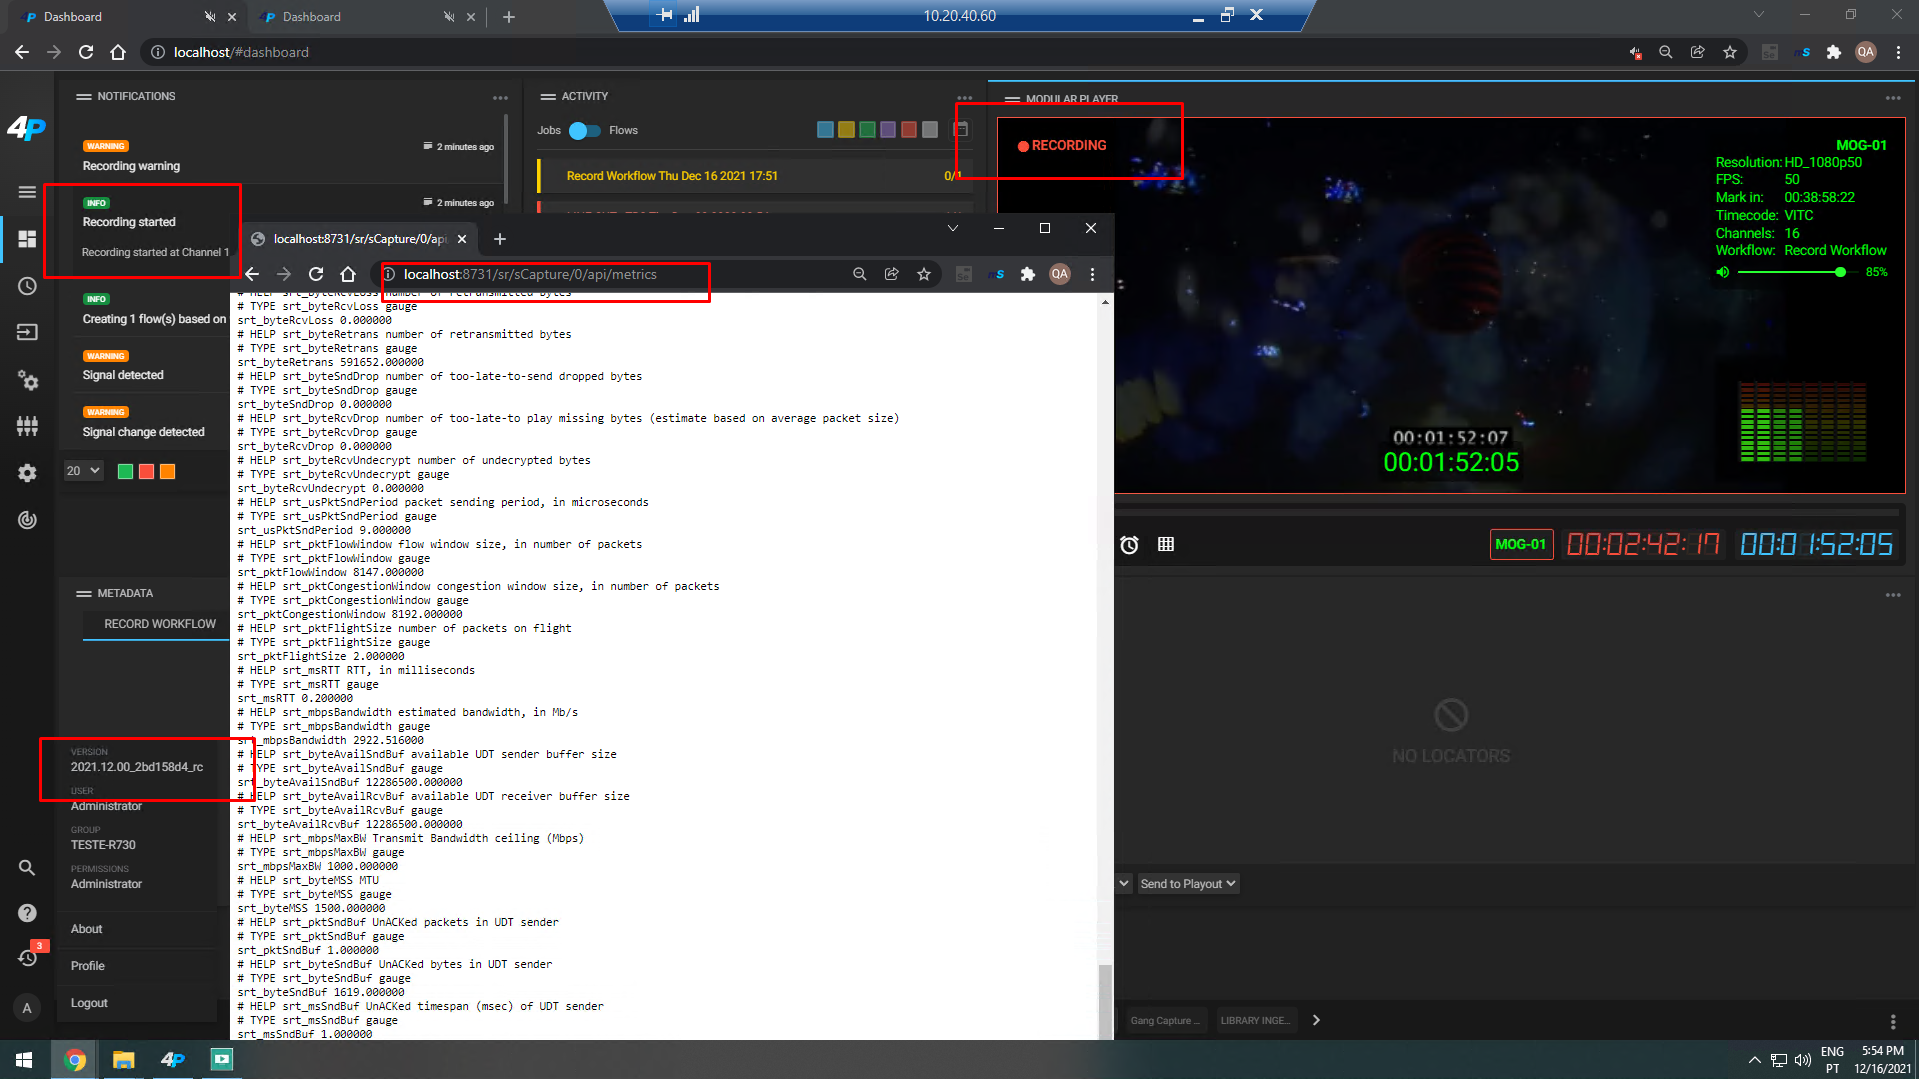
Currently, our implementation of SRT Protocol doesn´t provide a real time statistics monitoring and/or graphics in our user interface. However, there is a way to see all the metrics related to a specific sCapture service:
http://localhost:8731/sr/sCapture/0/api/metrics

As seen, this is not user friendly to analyse since it displays all parameters and it is hard to find out how to set up. Due to this, it’s easier to debug a SRT transmission using other 3rd party tools.
For additional info, please take a look at the following wiki:
https://gitlab.mog-technologies.com/customerservice/pre-sales/-/wikis/SRT