¶ Statistics
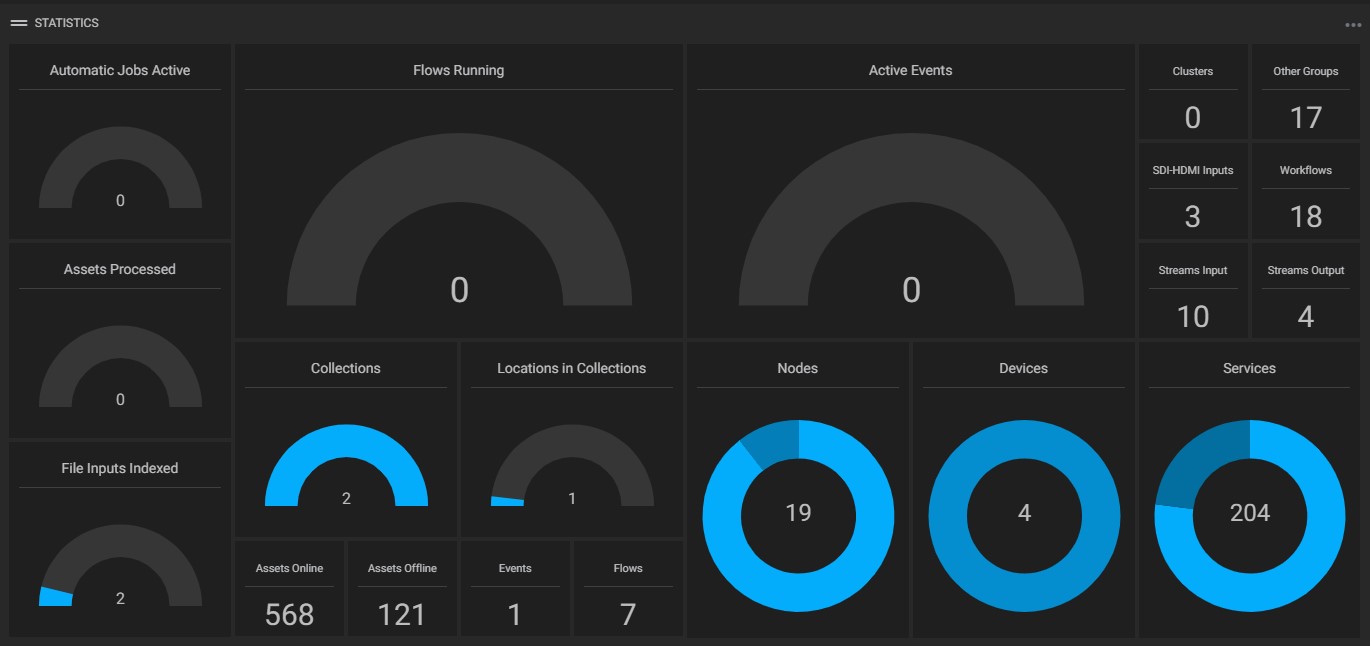
The “Statistics” widget displays information about the MAM4PRO instance since the system was created, and updates that information every 5 seconds.

The information transmitted in this widget are:
- Automatic jobs active: graph with the statistics of the automatic jobs currently active;
- Assets processed: graph with the statistics of the assets that have been processed so far;
- File inputs indexed: graph with the statistics of the file inputs currently configured;
- Flows running: graph with statistics of running flows;
- Collections: number of collections;
- Assets online: number of online assets;
- Assets offline: number of offline assets;
- Locations in collections: number of file locations whose assets are automatically linked to a collection;
- Events: graph with the number of scheduled and finished events;
- Flows: graph with the number of flows executed completely and with failure;
- Active events: graph with active event statistics;
- Nodes: graph with statistics of online, offline, and limited nodes;
- Devices: graph of configured device status;
- Clusters: number of clusters configured;
- Other groups: number of other groups that make up the current group;
- SDI-HDMI inputs: number of SDI-HDMI inputs currently configured;
- Workflows: number of workflow profiles configured;
- Streams input: number of stream inputs currently configured;
- Streams output: number of stream outputs currently configured;
- Services: graph with statistics for online and offline services.