¶ Dashboard
¶ Navigation and Actions
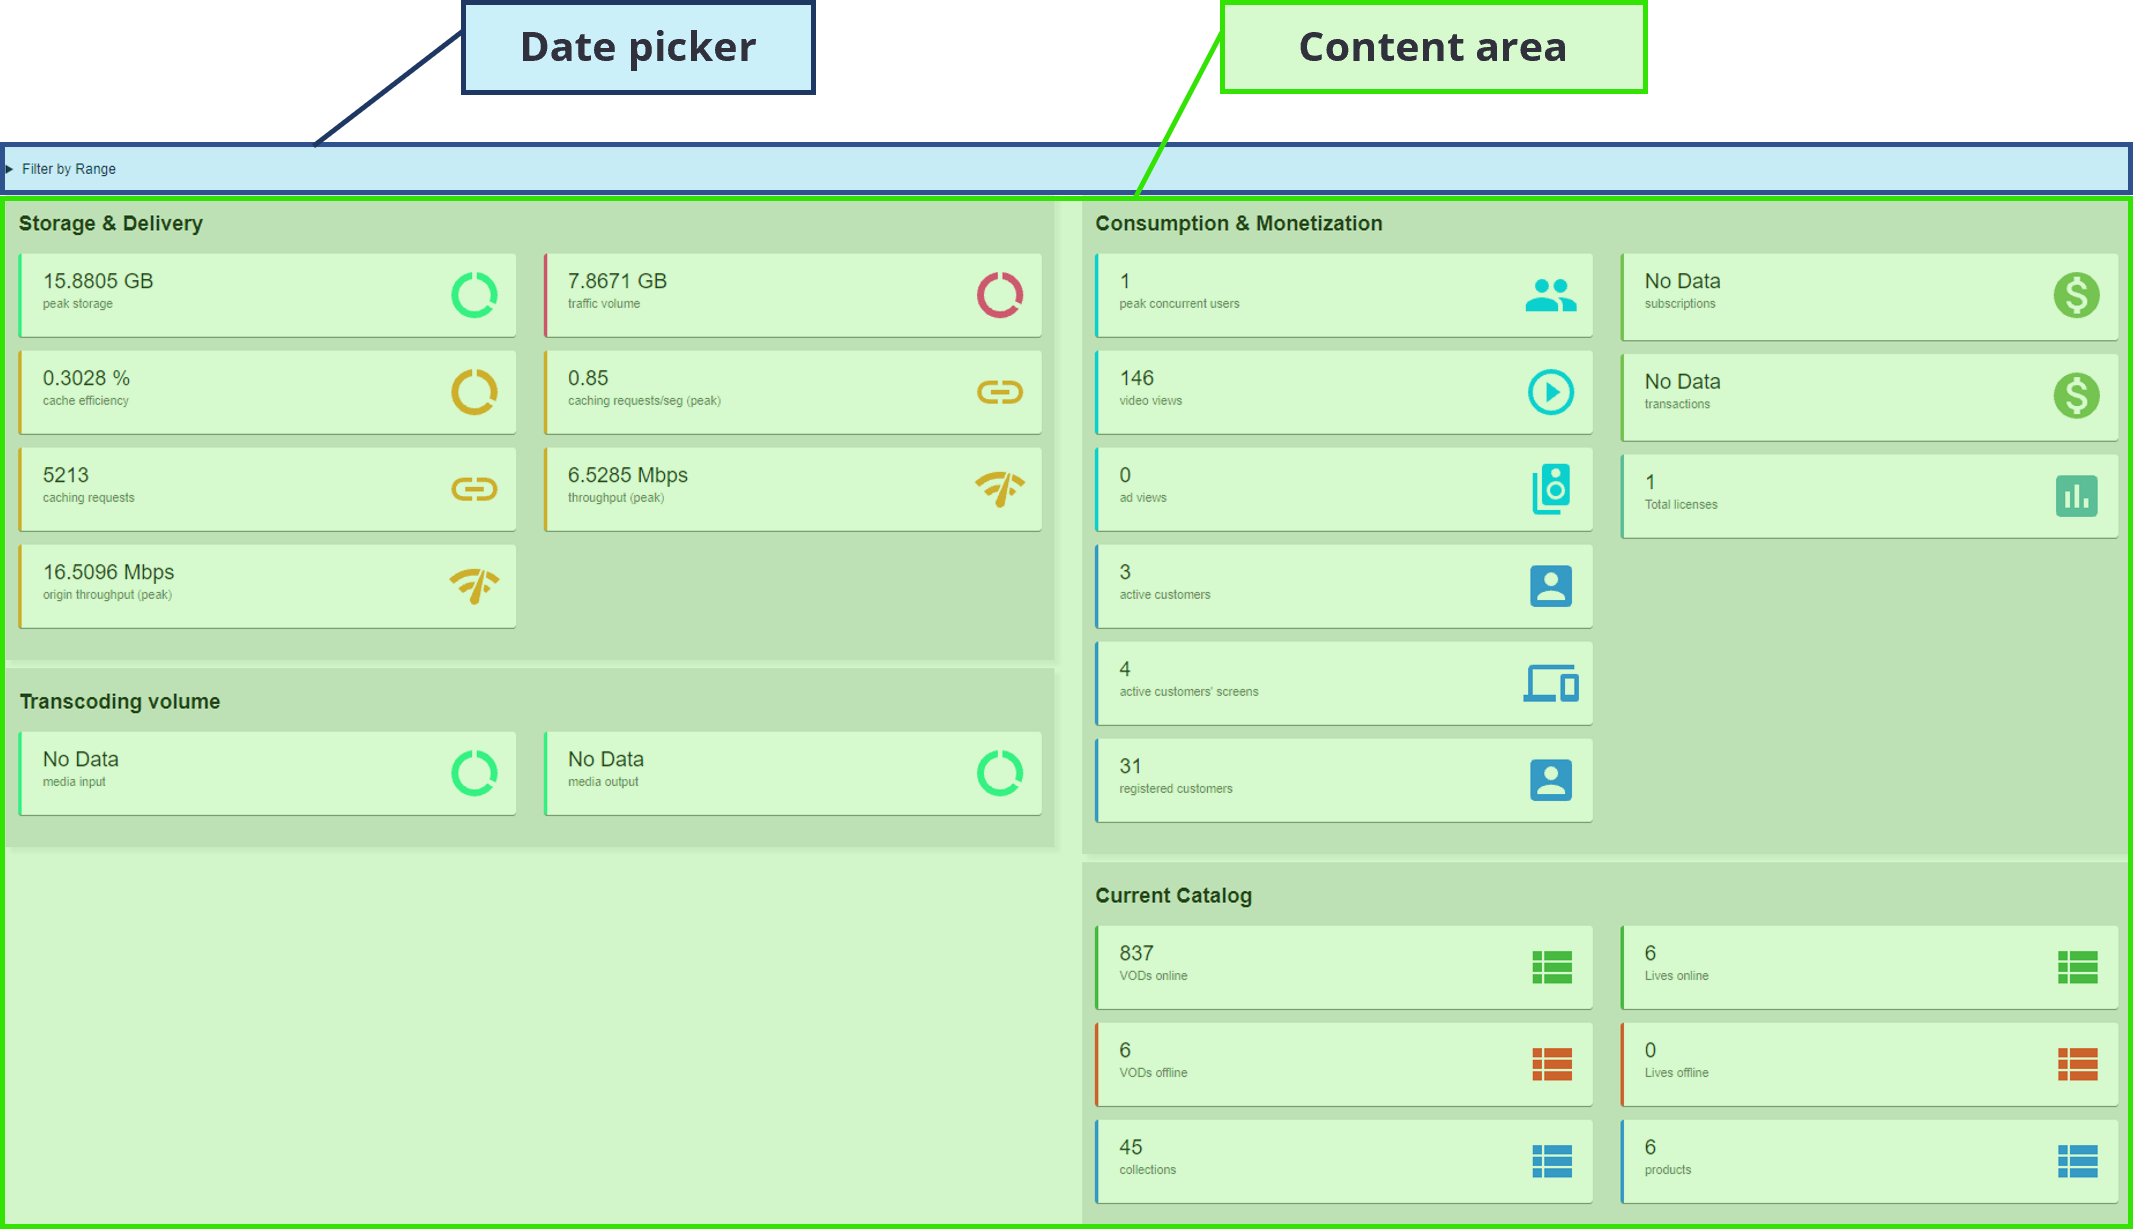
The content window for Dashboard consists of a free form display with summarized information about service usage and overall platform metrics.

-
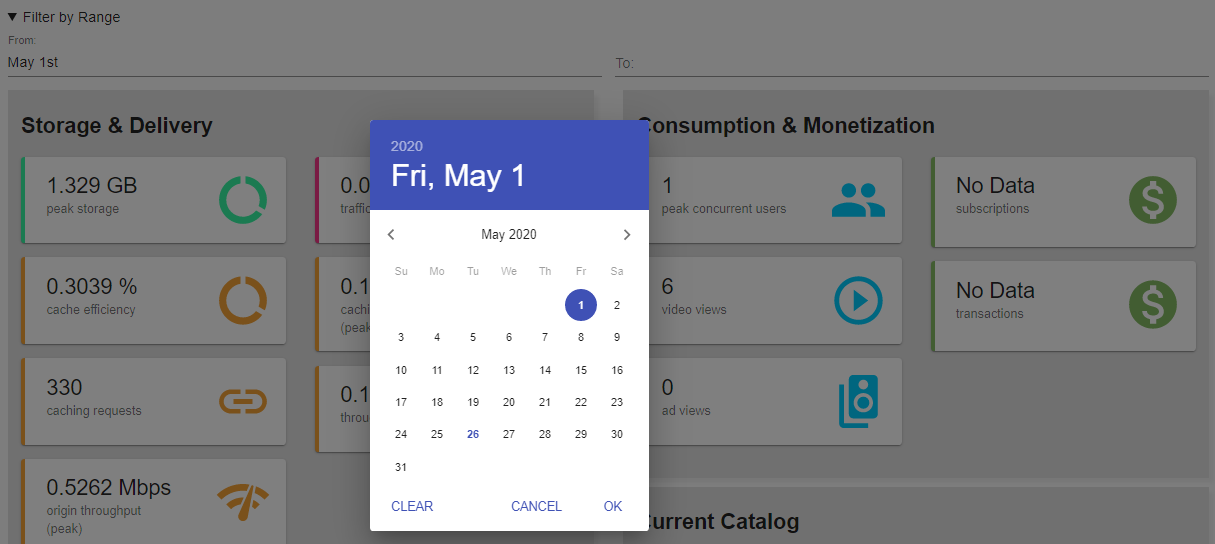
Date picker: by default, Vizzi will display the Dashboard data for the current month (month to date), but you can change the period by clicking “Filter by Range” and then “From” to select the start date in the calendar that will open. Click “OK” to confirm the chosen date, then specify the end date by clicking “To”, select the date and confirm by clicking “OK”. If the end date is not entered, the current day will be assumed;

-
Content area: dashboard area where information is displayed.
¶ Content
The Dashboard shows you the usage information of your back-office and frontend. Placing at your disposal the quantification of data sent, transcoded and visualized and also what was the monetary gain of the defined period.
- Storage & Delivery: in this group, you will see the volume of your content storage and the amount of traffic generated by your customers when viewing videos. You can analyze the watched content, how much content was cached, how many caching requests occurred and what were the peaks of data transfer;
- Transcoding volume: here you will see the volume of data (videos) uploaded to the platform and the volume of data generated when Vizzi converts the uploaded media into different video qualities and images used for posters and thumbnails;
- Consumption & Monetization: here you can see how much concurrency viewing you are experiencing, the number of videos and advertising served, how many customers are active, the number of active customers’ screens, the peak number of customer registered on the platform, the monetary gain through subscriptions and transactions, and the total licenses requested;
- Current catalog: here you can view the amount of content (online and offline) that is currently part of your back-office catalog, as well as the number of collections and products where these videos are organized into.