¶ Analytics Data Collection
Revision date: 09/dec/2022
Vizzi version: 1.12.0
In line with recent changes in today’s business environment, Vizzi helps make your decision-making more efficient. Through the integration with Google Analytics, you will be able to collect data from your end users and transform them into useful information, thus evaluating and measuring the performance of marketing, content, and products concerning user engagement.
¶ Let’s take a closer look at the collected data
To consult some of the data collected through the Vizzi backend, access the Analytics menu and define the date range you want to consult by clicking on the “Filter by Range” option in the upper left corner of the screen:

The information is organized into five groups and shown in seven different presentation graphs. Let’s go through each of them:
¶ Page Views
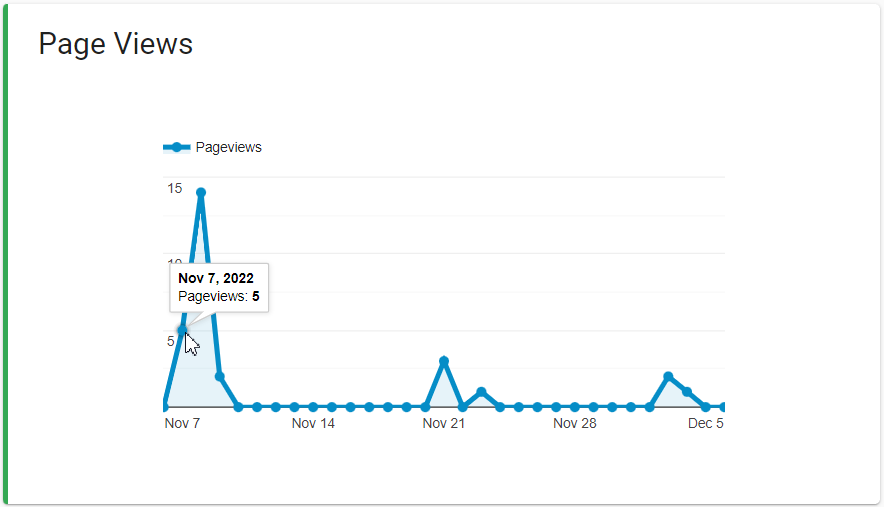
Shows the evolution of pageviews over the defined interval. Hover over the days’ dots to find exactly how many pages were viewed per day:
¶ Playback Time
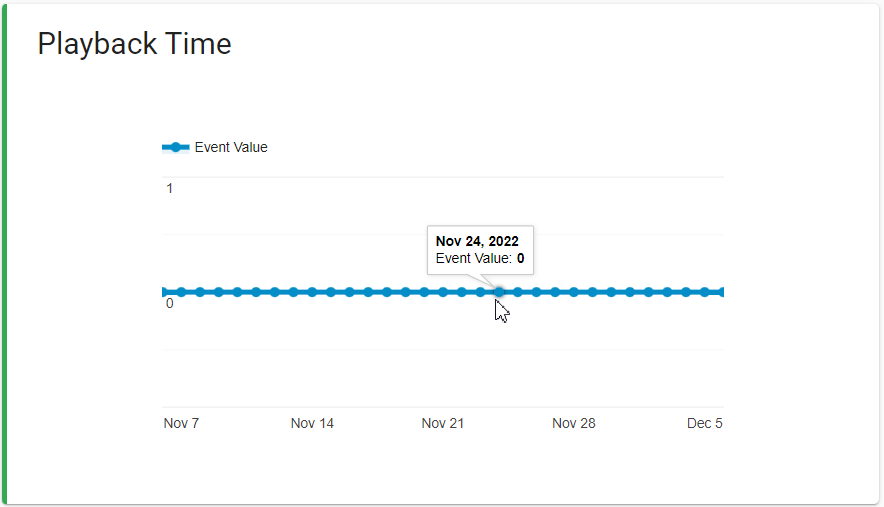
Represents how much video playback time your customers consumed per day in the chosen range:
¶ Ad views
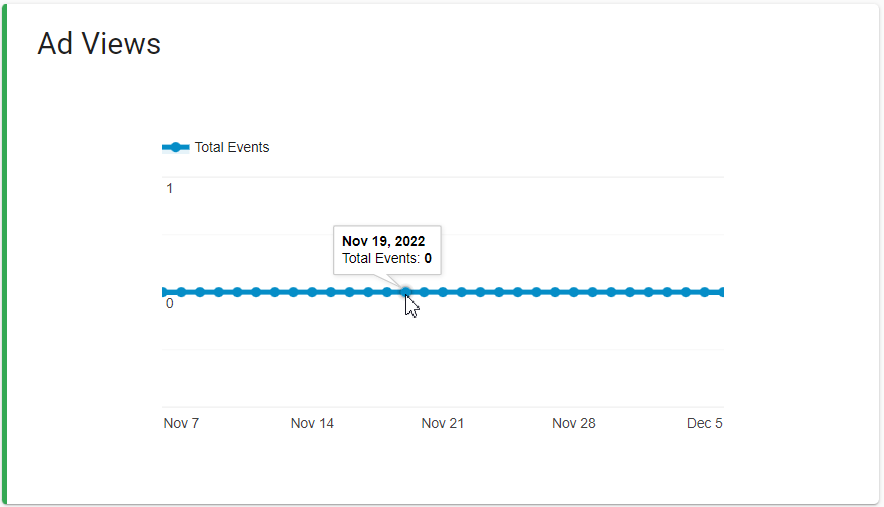
Displays the number of advertising views delivered per day over time:
¶ Video Views
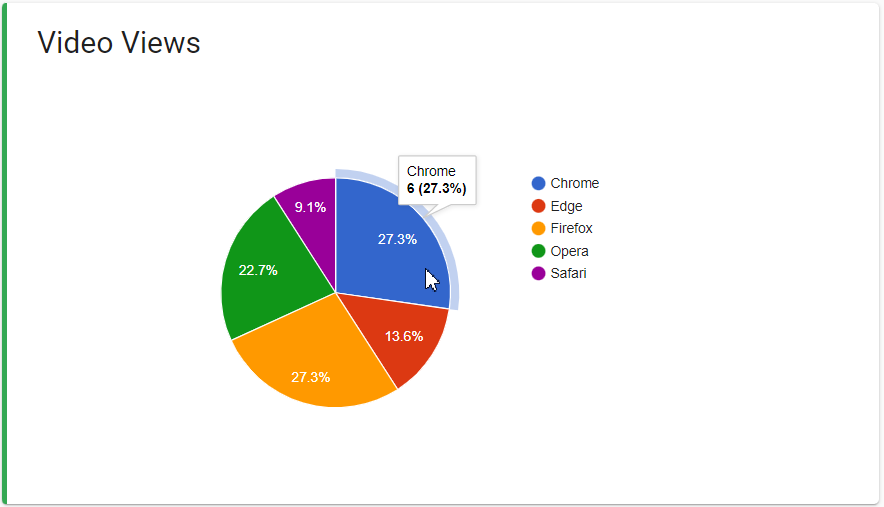
In three separate graphs, this group shows information about the number of video views served:
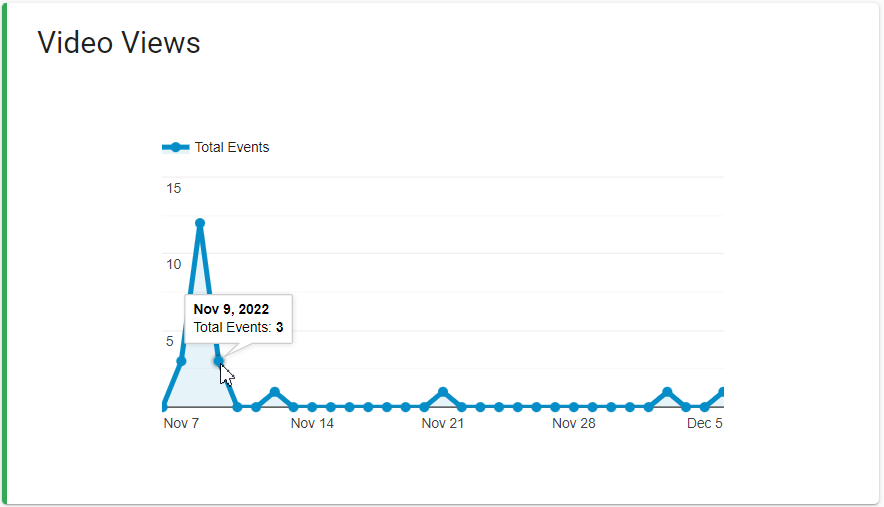 |
Evolution of the number of videos viewed day by day. |
Number and percentage of videos watched by agent (e.g. browser type). |
|
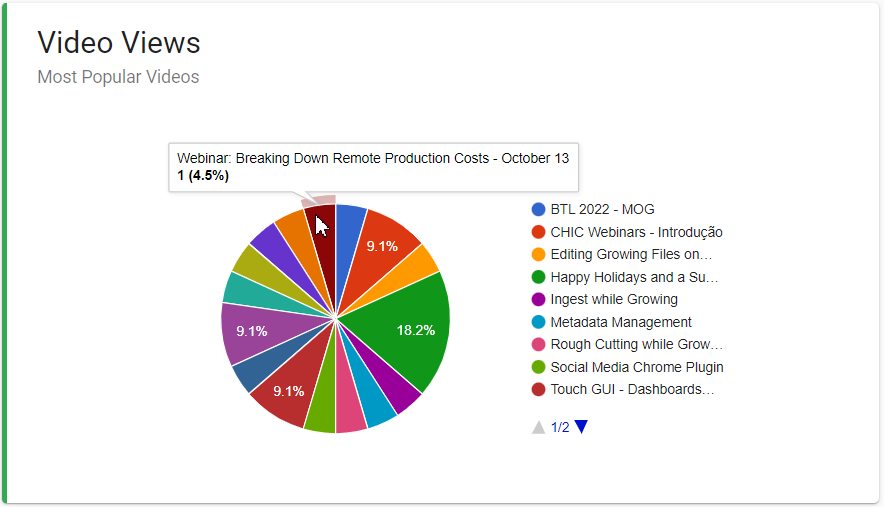 |
The popularity of the videos in your catalog is shown in the number of views and the proportional percentage. |
¶ Sessions per Country
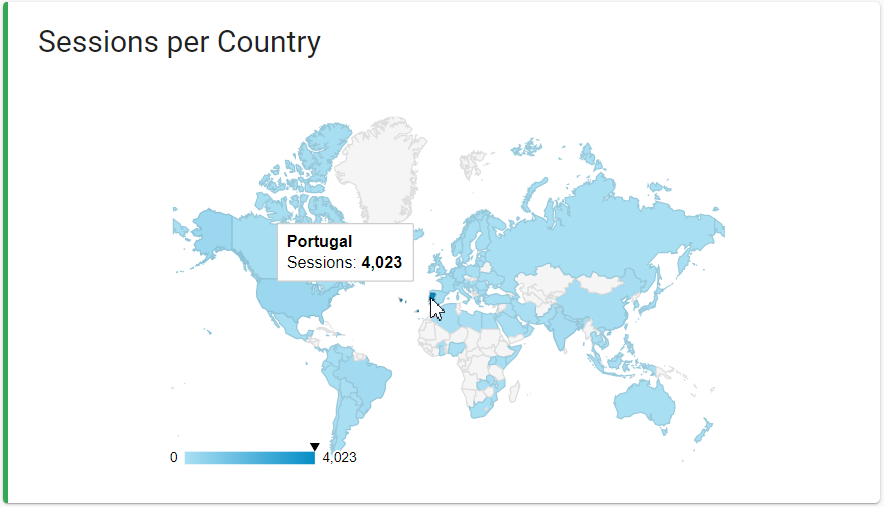
Displays information about the geographical distribution of the audience for the selected time range:
All other data collected by Vizzi can be consulted through the Google Analytics console.
Note: for analytics to be collected, your Google Analytics credentials must have been previously configured. To learn how to enter this information, see this guide.
It is undeniable that data analysis makes it easier to predict trends and, consequently, customer satisfaction. So make the most of this value that Vizzi can offer your business.