¶ Consulting Usage Data
Revision date: 12/jun/2024
Vizzi version: 1.14.3
Vizzi provides an effortless and transparent way to consult your platform usage data, making it possible to manage more accurately what happens on your backend and frontend. On a single page, you have at your disposal, for example, the quantification of the data sent, transcoded, and visualized, as well as the monetary gain over a predetermined period.
¶ The Available Data
To consult the usage data of your Vizzi platform, access the Dashboard menu and define the date range you want to check by clicking on the “Filter by range” option in the upper left of the screen:
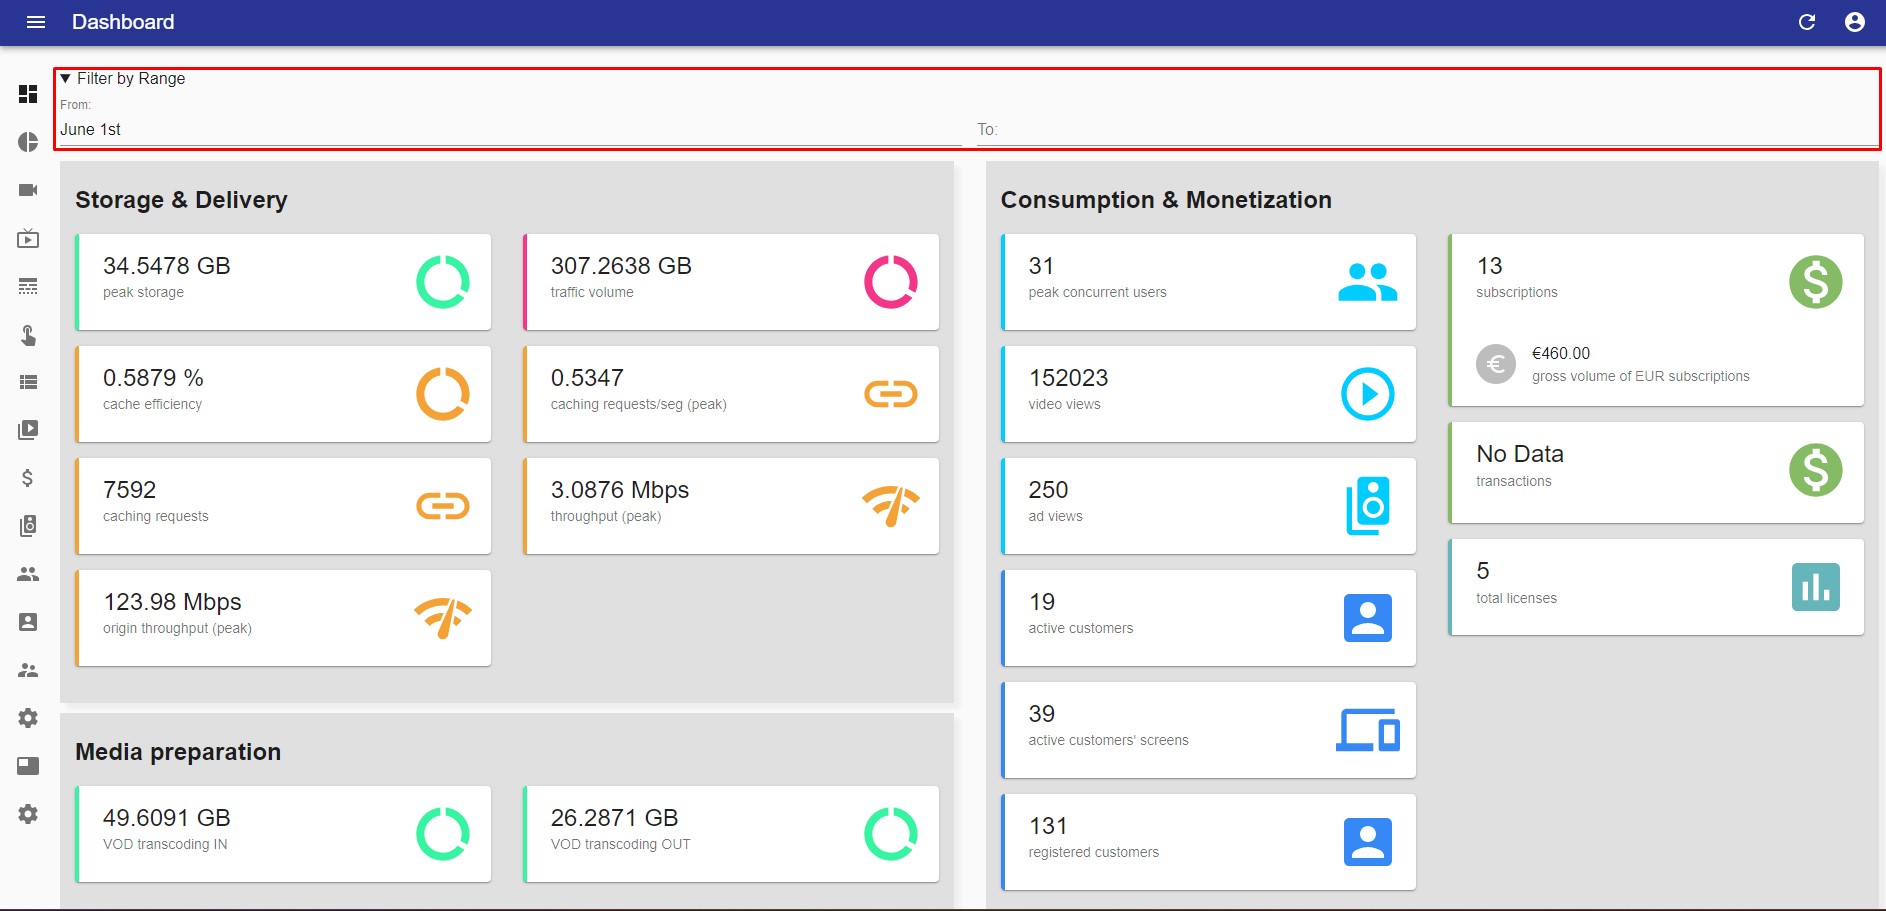
The indicators are divided into four groups. Let’s go through each of them.
¶ Storage & Delivery Data
To better understand the data presented in the Storage & Delivery group, it is important to know that Vizzi delivers content around the world using Content Distribution Networks (CDN) which are a group of geographically distributed servers that accelerate the delivery of the content, bringing it closer to where users are. In other words, CDNs store content on an origin server. When there is a request for access to content, for example, when a customer plays a video, that content will be cached on a proxy server close to the user’s physical location.
Taking this concept into account, we can analyze the data presented in this group:
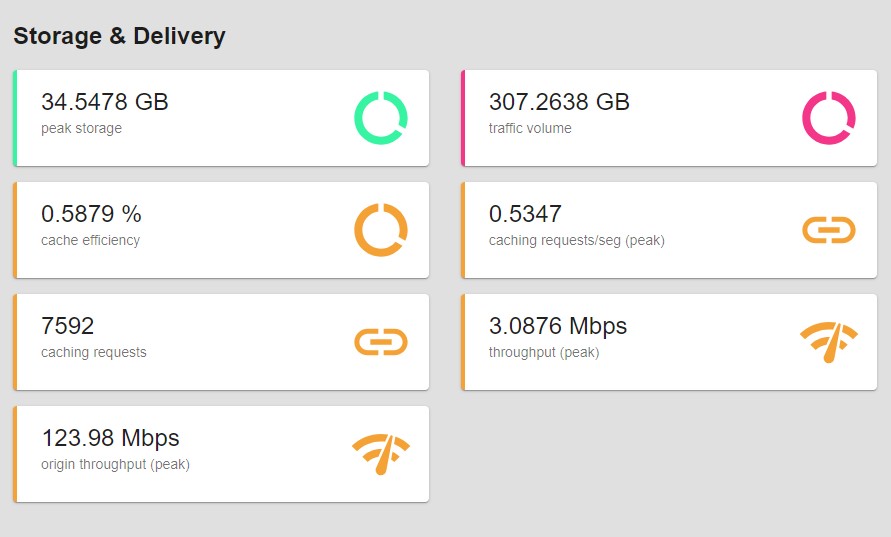
- Peak storage: the maximum amount that has already been stored in your Vizzi instance (e.g. video files, image files, etc)
- Traffic volume: volume of data traffic served to your customers
- Cache efficiency: percentage of traffic requests that were already cached vs traffic requests that were not cached
- Caching requests/sec (peak): peak cached content request per second
- Caching requests: number of caching requests
- Throughput (peak): throughput outbound from proxy servers
- Origin throughput (peak): outbound throughput from the origin server
¶ Media Preparation
All content added to Vizzi is transcoded to different qualities and formats configured. In this way, in this group, you can check the following data:
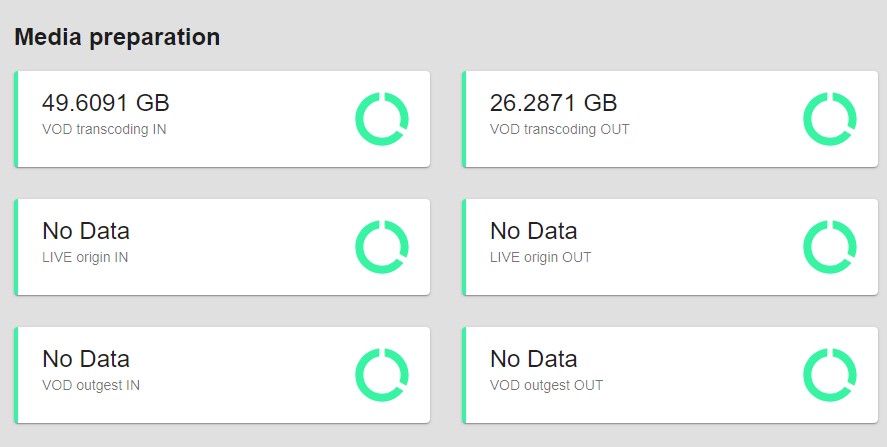
- VOD transcoding IN: volume of data uploaded to the transcoder when using the Vizzi backend upload function
- VOD transcoding OUT: volume of data generated by the transcoder when using the Vizzi backend upload function
- Live origin IN: volume of live input data ingressed to the MOG decoder system
- Live origin OUT: volume of live output data generated by the MOG encoder system
- VOD outgest IN: volume of VOD input data ingressed to the MOG transcoder system
- VOD outgest OUT: volume of VOD output data generated by MOG the transcoder system
¶ Consumption & Monetization
Through this group, you can consult the following consumption and monetization data from your platform:
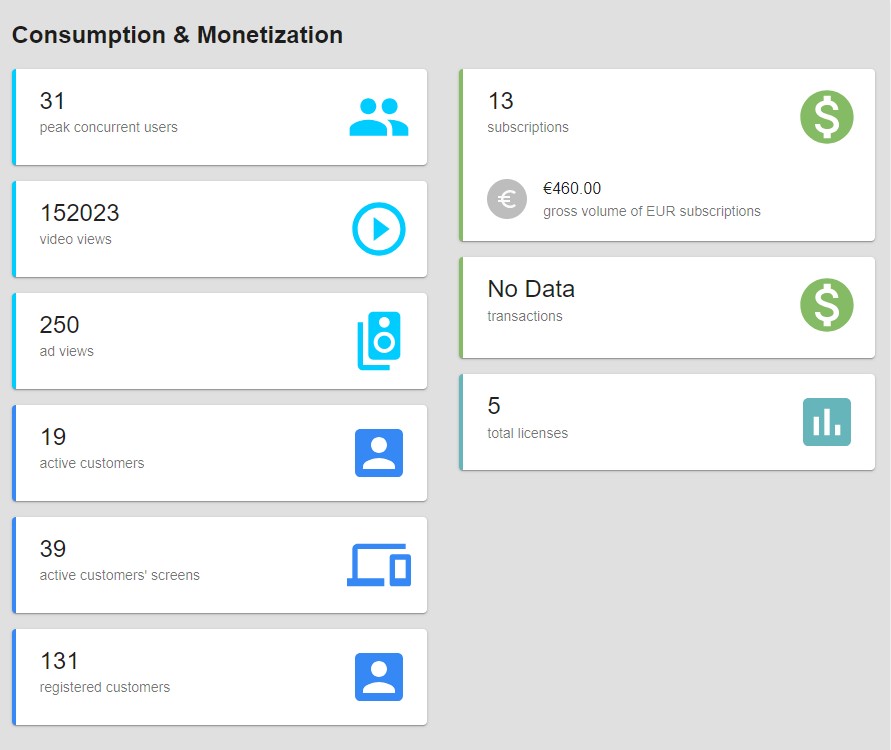
- Peak concurrent users: maximum number of users accessing the platform at the same time
- Video views: number of videos played
- Ad views: the amount of advertising viewed
- Active customers: number of customers that have logged in at least once during the defined period
- Active customers screens: number of unique screens/devices used by customers to access the platform. For example, imagine that the same customer is connected via Google Chrome browser, Firefox browser, iOS mobile, and Android mobile. In this case, we will have four active screens for that one customer
- Registered customers: peak number of customers registered on the platform
- Subscriptions: monetary gain through subscriptions
- Transactions: monetary gain through transactions
- Total licenses: number of DRM license requests served
¶ Current Catalog
In this group, you can track the size of your content catalog:
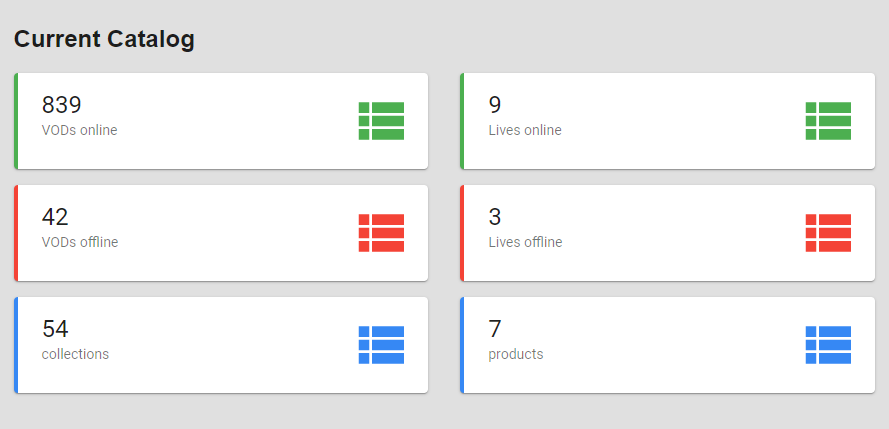
- VODs online/offline: number of videos that are currently part of your content catalog
- Lives online/offline: number of lives that are currently part of your content catalog
- Collections: number of collections where these contents are organized into
- Products: number of products where the collections are organized into
With Vizzi, all your essential usage data is in one place, so you can easily monitor the success of your platform.
For more details on setting up Vizzi, please refer to the Dashboard page of the online user manual.