¶ Analytics
Revision date: 12/jun/2024
Vizzi version: 1.14.3
¶ Navigation and Actions
The content window for Analytics consists of a free form display with analytics data about service consumption from your customers.

¶ Common
By default, Vizzi will display the analytics dashboard data for the last 30 days, but you can change the period by clicking “Filter by Range”. See step 1 of chapter Dashboard > Navigation and Actions.
¶ Content
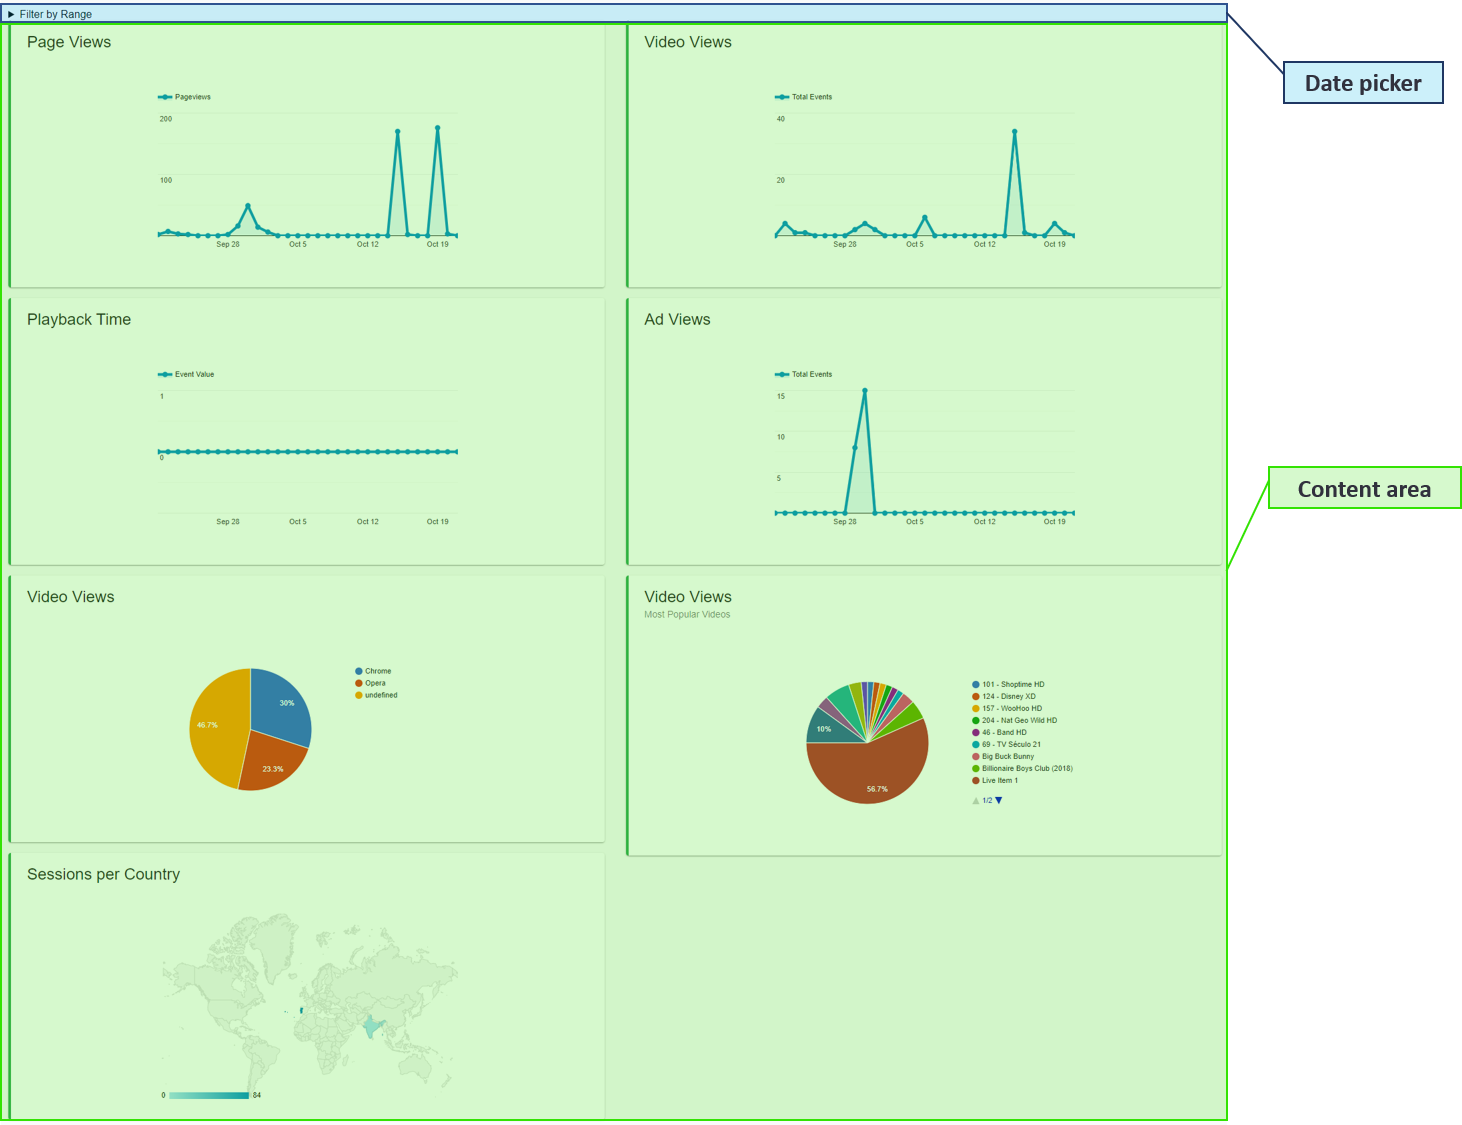
The information is organized into five groups and shown in seven different presentation graphs.
- Page views: displays the evolution of page views;
- Playback time: displays the evolution concerning playback time (how much video playback time your customers consume);
- Ad views: displays the number of advertising views distributed along time;
- Video views: displays information regarding the number of video views served.
a. Evolution of the number of videos viewed day by day;
b. Number and percentage of videos watched by agent (e.g. browser type);
c. The popularity of the videos in your catalog, shown in the number of views and the proportional percentage. In this graph, a new custom dimension must be created in your Google Analytics account. Please follow the steps described in “Adding a custom dimension in Google Analytics” chapter to find out how to do this. - Sessions per country: displays information about the geographical distribution of viewership.
Note: in the analytics content window you can mouse over the graphics for more details.